Posts
Securitisation, Transfer and Distribution of Credit Risk- for Banks and NBFCs.
We are pleased to announce the launch of our e-book — Securitisation, Transfer and Distribution of Credit Risk- for Banks and NBFCs.
This book, spanning over 900+ pages, provides a comprehensive analysis of the evolving regulatory and transactional landscape relating to credit risk transfer in India, with detailed commentary on:
• RBI regulations on securitisation
• Transfer of Loan Exposures or so-called direct assignments
• Co-lending arrangements
• Loan syndication arrangements
• SEBI regulations governing the issue and listing of securitised debt instruments
Designed specifically for banks, NBFCs, market participants, legal professionals and compliance teams, the publication offers practical insights into the regulatory framework governing structured finance and credit distribution transactions.
The Commentary is based on RBI’s November, 2025 version of consolidated Directions.
The book was launched during the 14th Securitisation Summit, and the e-book is available exclusively through the Premium Section of our website.
Kindly note that access to the book will be for a period of one year from the date of purchase of the book.
Read an excerpt from the book here.
Click here to purchase now directly, or
Indian Securitisation in FY26: Securitised Paper Volumes grow, with originator and asset diversity
– Vinod Kothari & Chirag Agarwal | finserv@vinodkothari.com
Volumes of securitisation (which, of course, have always included bilateral assignments or so-called DA transactions) fell by 6% in FY 26, if the origination volume by Reliance group entities in the first half were to be excluded. However, the market has shown more originator diversity, with an increasing share of smaller issuers, including those tasting the market for the first time.

The dip in volumes is because of the larger issuers who were prominently absent or subdued – Shriram Finance as the largest issuer having raised on-balance sheet liquidity, and banking companies. However, the share of gold loans went up sharply, largely due to the sharp increase in gold prices and gold lending, Microfinance companies went more for securitisation, rather than direct assignment transactions.
For anyone studying the Indian securitisation market, it is important to note the following:
- Reported volumes in India include direct assignments, which, in international parlance, are not “securitisation” (pure bilateral loan sales). However, in India, traditionally, DA has been a close and quick proxy for securitisation, and hence, mostly included. In FY 26, the split of DA/PTC volumes shows PTC transactions having gained in proportion. One rating agency1 reports an increase of PTC volume percentage from 54% to 60%; another one2 shows the increase from 48% to 52%.
- Indian transactions mostly show LAP transactions as a part of MBS, whereas what the world reports as RMBS is quite small in India. Last year, there was a prominent transaction by LIC Housing Finance, through the NHB-promoted RDCL. There was no RDCL issuance this year. It seems that RMBS volume was either too small to be reportable, or was completely absent.
- Microfinance sector has been under some stress in the recent past; however, MFIs have increasingly resorted to PTC issuances, with small deal sizes. Some deal sizes are even below 100 crores. This is indicating greater diversity of issuers, and of course, yields and ratings.
- The market also seems to be showing larger acceptance for lower rated securities i.e., BBB+.
Overall, in a stressful global scenario, securitisation has stood firm. Non financial sector entities have shown increasing willingness to tap the market. Of course, SEBI regulations have to be more enabling.
Below, we give a detailed overview of the securitisation market, including a discussion on the asset classes.
NBFCs vs Banks
Securitisation volumes have been largely driven by NBFCs, which recorded a 30% year-on-year increase in value. In contrast, originations by banks have declined significantly.
Recent Securitisation Structures in India – A Mix of Tradition and Innovation
Among asset classes, vehicle loans (including commercial vehicles and two-wheelers) accounted for 50% of securitisation volumes (vs 47% in the corresponding period last fiscal). Mortgage-backed loans accounted for about 28% of securitisation volume (vs 37% in the last FY).
Vehicle loan-backed securitisations dominated the market, both in terms of number of deals and total value, reaffirming the sector’s strong position. This is consistent with the growth trend in vehicle loan originations during FY 25.
In addition to vehicle loans, originators also securitised receivables from a diverse set of underlying asset classes during Q4, including:
- Microfinance Loans
- Secured Business Loans
- Unsecured Business Loans
- Home Loans
- Unsecured Personal Loans
- Gold Loans
The continued diversification in underlying asset classes highlights the evolving maturity of India’s securitisation market and growing investor appetite across segments. The break-up of securitisation volumes across various asset classes have been presented below:

Securitisation of Vehicle Loans
The issuance volume for vehicle loan securitisation during FY26 was approximately ₹1.26 lakh crores. Most of the transactions were structured as single-tranche issuances. However, a few exceptions featured more layered structures comprising senior and equity tranches, or senior, mezzanine, and equity tranches.
In terms of credit ratings, the tranches were rated between A- and AAA. Notably, the senior tranches in the majority of transactions received high investment-grade ratings, typically falling within the AA+ to AAA range. This indicates strong investor confidence and reflects the underlying credit quality of the asset pools, supported by adequate credit enhancement mechanisms.
Further, replenishing structures were also observed commonly during FY26. These variations indicate growing sophistication in transaction structuring within the vehicle loan securitisation space, aimed at catering to different investor preferences, improving credit protection, and aligning with originator risk appetite. As the market matures, further innovation in structuring and risk mitigation features can be expected.
In terms of credit enhancements, most vehicle loan securitisation transactions during the last quarter of FY26 featured: cash collateral (CC) and overcollateralisation (OC), with the Excess Interest Spread (EIS) serving as the first layer of loss absorption.
Securitisation of Microfinance Loans
During FY26, the MFI sector has seen a revival after a period of stress during FY 25 and FY 24. This has been due to better credit underwriting of lenders, improving performance trends and granular pool characteristics. Further, after a period of stress, the lenders relied on time-tested borrowers rather than exploring new markets leading to higher average ticket size of loans. This has led to a growth in the volumes of securitisation of microfinance loans during FY26. The PTC issuance volume of microfinance institutions increased to 14% of total PTC issuance in FY26 from 6% of total PTC issuances in FY25. Most of the transactions were structured as a single tranche securitisation.
Further, most microfinance loan securitisation transactions during the quarter featured credit enhancement through two primary mechanisms: CC and overcollateralisation OC, with the EIS serving as the first layer of loss absorption.
Securitisation of pool of loans backed by Home Loans & LAP
The volume of mortgage backed securitisation has been low both in terms of number as well as in terms of amount of issuance. As compared to FY25, the total MBS issuances dropped to 28% of total issuance from 37%. The transactions featured a common waterfall matrix and had received an overall rating of AAA.
In terms of credit enhancement, CC and OC has been provided as a credit enhancement with the EIS serving as the first layer of loss absorption.
Securitisation of Gold Loans
Gold loan securitisation volumes in H2FY26 stood at approximately ₹18,500 crore, significantly higher than the ₹5,000 crore recorded for the whole of FY25.
The jump in gold lending securitisation may be due to increase in gold prices and resultant increase in the value of the collateral. As a result of this valuation spike, average ticket sizes have increased, indicating that as gold valuations rise, consumers are leveraging higher-value loans to meet their financing needs. Another reason for the increased origination may be removal of LTV restriction in case of income generating gold loans.
Securitisation of Unsecured Loans
As per rating rationales published by Care the securitisation volumes of unsecured loans (both personal and business) increased during FY26. Investors in unsecured loan transactions, are preferring the PTC route, due to the support provided by external enhancement. CC and OC have also been provided as a credit enhancement with the EIS serving as the first layer of loss absorption.
- Secure with Securitisation: Global Volumes Expected to Rise in 2025
- India securitisation volumes 2024: Has co-lending taken the sheen?
- Indian securitisation enters a new phase: Banks originate with a bang
- Securitisation: Indian market grows amidst global volume contraction
- Crisil report on securitisation volumes: https://www.crisilratings.com/en/home/newsroom/press-releases/2026/04/securitisation-deal-value-peaks-to-rs-2-55-lakh-crore-in-fiscal-2026.html ↩︎
- Care report on securitisation volumes
https://www.careratings.com/uploads/newsfiles/1775801608_FY26%20Retail%20Securitisation%20at%20Rs%202.53%20Trillion%20First%20Dip%20PostPandemic.pdf ↩︎
Indian Securitisation Awards, 2026
Nominate your deal through here: https://forms.gle/qGBwDD3rktYKmCzB8
 Loading…
Watts to Wealth: NITI Aayog’s ₹45,500 Cr Securitisation Plan for power sector
Dayita Kanodia and Simrat Singh | Finserv@vinodkothari.com
Background
Under the National Monetisation Pipeline (NMP) 2.0, released on February 23, 2026 NITI Aayog has proposed securitisation of ₹45,500 crore of future cash flows in the power sector as part of the overall ₹16.72 lakh crore monetisation target for 5 year period FY 2026-FY 2030.
The NMP was introduced in 2021, which provided a framework to unlock value from brownfield and greenfield public-sector assets and reinvest these resources into new infrastructure creation. NMP 1.0 achieved 90% of its ₹6 Lakh Crores monetisation target in the 4 year period FY 2021 – FY 2025. Now, NMP 2.0 seeks to carry forward this vision with a higher target and greater reserve of assets.
NMP 2.0 seeks to use a wide range of monetisation modes for raising finance, including InvITs, PPP user models, disinvestment, IPOs, FPOs, Leasing, private placement of securities, securitisation etc.
Securitisation as a mode of monetisation
Securitisation is being envisaged for the power sector since the sector has predictable and stable revenue streams ideal for securitisation. Further, securitisation would be suitable for operational PSU assets that do not require developmental or major operational support. The identified asset classes and targets are:
- Operational hydro power stations of NHPC and SJVN – ₹12,000 crore;
- Power Guarantee Corporation of India Limited (PGCIL) transmission assets – ₹33,500 Crores;
Under NMP 2.0, for securitisation to be counted as monetisation, transactions must comply with certain guidelines, including the following:
- No charge on the PSU’s balance sheet;
- No corporate guarantee;
- Repayment backed solely by securitised cash flows;
- Escrow mechanism for cash flow ring-fencing;
- Proceeds earmarked for capex or debt reduction;
- First charge on cash flows to lenders, with residual cash flows retained by the PSU.
The securitisation proceeds will be retained by the respective PSUs and deployed towards capital expenditure and capacity addition.
Mechanics and Regulatory Considerations
Securitisation under NMP 2.0 would essentially be a future flows securitisation; a topic we dealt with in our white paper. Under this, future cash flows are converted into tradable securities and the issuers can raise upfront capital from the issuance of these securities, effectively monetising their future income. The process generally involves the following steps:
- Identification of Future Receivables: The originator (which would be the PSU in the present case) identifies a pool of receivables expected to arise over time.
- Transfer to SPV: The rights to these future receivables are legally assigned or pledged to a bankruptcy-remote SPV. This separation ensures that the cash flows are shielded from the originator’s insolvency risk;
- Structuring and Credit Enhancement: The SPV issues securities backed by the expected future flows.
- Payment of interest and principal to the investors: The investors will need to be regularly serviced by cash flows generated from the underlying receivables. On maturity, the principal payments would also be made to the investors.
If the transaction is structured as per the conditions above, it may look like the following:
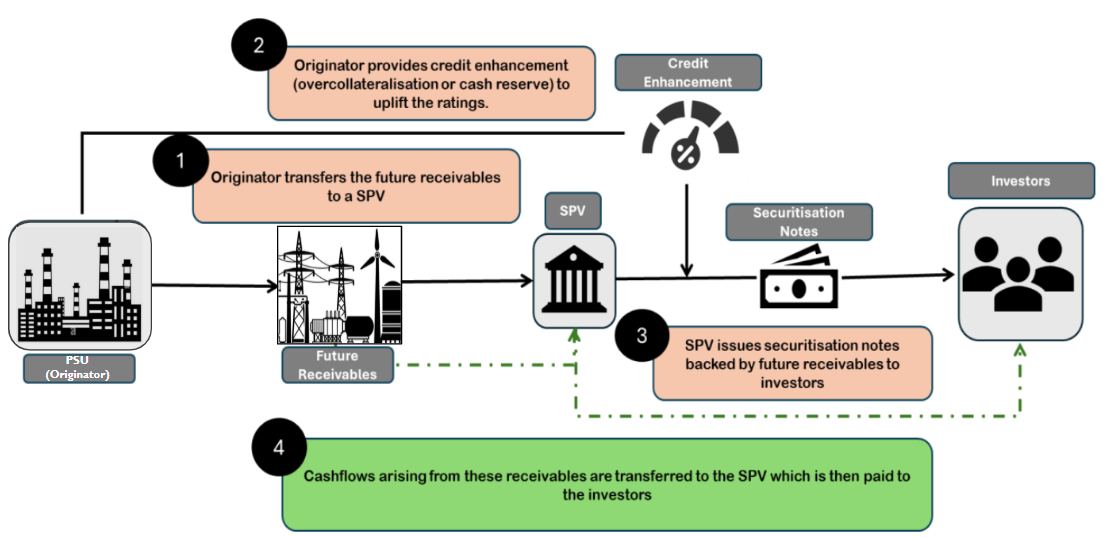
Typically the credit enhancement is overcollateralisation and structural credit enhancement by issuing multiple classes of notes (i.e. class A and B notes) is usually missing. There may be a DSRA/Cash reserve too to take care of any mismatches. See our write-up on future flows here.
Regulatory framework:
Future flow securitisation in India sits at the intersection of RBI and SEBI regulations, but does not fit neatly within either. The RBI’s SSA Directions apply only to RBI-regulated lenders (banks, NBFCs, financial institutions) and presuppose the transfer of existing financial assets. Therefore, securitisations under the NMP 2.0 where non-financial sector PSUs are involved will fall outside the SSA regime.
Further, in case capital market issuance or listing is contemplated, securitisation transactions fall under the SEBI (Issue and Listing of Securitised Debt Instruments and Security Receipts) Regulations, 2008.
However, post the 2025 amendments, SEBI has defined eligible “debt/receivables.” Under this definition, only specified categories (such as mortgage debt, leasing receivables, trade receivables, rental receivables, etc.) are currently permitted. Accordingly, the assets under NMP 2.0 will not fall under the definition of eligible assets as per the SEBI SDI Framework unless specifically notified by SEBI.
Further, conditions such as obligor track record requirements and minimum holding period norms designed for traditional loan securitisations may be structurally incompatible with pure future receivable structures.
It may be noted that it is essential for a securitisation transaction to fall within the purview of either RBI’s SSA Directions or the SEBI SDI Framework from the purview of taxation.
Taxation is governed by Section 115TCA of the Income Tax Act, 1961, which grants pass-through status to securitisation trusts created under the RBI SSA Directions or SEBI SDI Framework. Income received by investors is thus taxed as if they had directly earned the underlying income, ensuring single-level taxation.
Therefore, if a future flow securitisation falls outside both the RBI and SEBI frameworks, the SPV may be taxed under general trust taxation principles, potentially at the maximum marginal rate. This creates a material tax inefficiency. Accordingly, for future flow securitisation to be viable at scale, regulatory eligibility under the SEBI SDI framework and, thereby, access to Section 115TCA pass-through treatment becomes critical.
Further, it may also be noted that under the SSA Directions, for making any investment in securitisation transactions which are outside the purview of the SSA Directions, full capital will need to be maintained.
This discourages banks from making investments in securitisation transactions outside the purview of the SSA Directions.
Accordingly, for the success of NMP 2.0, the following two amendments are necessary:
- Amendment in the definition of eligible assets to permit future flows
- Necessary amendment in the SSA Directions to encourage bank participation in the securitisation notes issued by non-financial sector entities.
InvITs
InvITs are used to monetise mature and revenue-generating brownfield assets, primarily in the road and power transmission sector, by transferring them into a trust that raises capital from institutional and retail investors. The sponsoring PSU (eg. NHAI) receives upfront proceeds from units issued by the InvIT. See our whitepaper on infrastructure securitisation here.
Notably, the NMP 2.0 also proposes monetisation of approx ₹3,35,000 Crores worth of highway assets under the InvIT/TOT models. This would be done through NHIT or another similar publicly listed InvIT.
Three types of highway stretches are identified for this purpose, along with respective monetisation targets:
- Stretches where user fee is accruing to NHAI – ₹2,31,900 Crores;
- Projects at the end of their concession periods – ₹60,000 Crores; and
- Under-construction stretches where user fee will accrue to NHAI – ₹43,600 Crores.
Under the NMP, the total monetisation value under InvIT mode is calculated based on the market approach, i.e. funds raised by the InvIT against the underlying asset portfolio. In the case of highways, the proceeds from TOT and InvIT projects shall flow to NHAI and shall ultimately accrue to the Consolidated Fund of India.
Conclusion
Using future flow securitisation as a means for funding infrastructure has been common worldwide. Such transactions include the securitisation of metro ticket receivables in China, where the proceeds from the securitisation of future ticket receivables were used to repay the bank loans taken by the originator for building the metro infrastructure.1
Further, in Indonesia, toll road receivables were securitised to build the Jakarta-Bogor-Ciawi toll road.2
The NMP 2.0 proposes to use securitisation for financing. However, it is essential that necessary regulatory amendments be carried out to ensure sucess of this mode of financing and for promoting many more similar future projects.
Significant Risk Transfer: Market, Structures, Economics and Risks
Vinod Kothari and Dayita Kanodia | Finserv@vinodkothari.com
Introduction
Known by various alternative names as “synthetic risk transfers”, “credit risk transfers”, “on balance sheet securitisation” or “synthetic securitisation”, Significant Risk Transfers (SRT) have a history of over 25 years but have recently grown faster than other components of either traditional securitisation or credit derivatives. The pool value of banks’ synthetic securitizations has surpassed $670 billion, and the global sales of SRTs are expected to expand 11% annually on average over the next two years.
This article discusses SRT Transactions, the state of the market, different structures used, risks, capital benefits, and the regulatory permissibility of such transactions in different countries. Finally and quite significantly, this article makes a case as to why India, which is one of the very countries in the world presently prohibiting such structures, should rethink.
Market Overview
As per a report published by the International Association of Portfolio Managers, by the end of 2024, over € 700 bn of securitized loans were protected by $ 75 bn (9%) of SRT tranches, some 70% being issued by European banks. Further, the International Association of Credit Portfolio Managers reported that between 2016 and 2023, nearly 500 SRT transactions protected underlying portfolios adding to $ 1 trillion in loans, ranging from corporate loans to auto loans.

Period 2016- 2024 portfolio under SRTs totaled Euro 1311 billion (or roughly USD 1500 billions). In 2024, Europe, excluding the UK, took Euro 152 billion out of the Euro 260 billion protected portfolio.
Thus, nearly half of the SRT deals have originated from EU countries. The proportion was even larger historically, but US banks started aggressively getting into SRT Transactions in 2025.
SRT transactions have existed even before the Global Financial Crisis. In 2021, EU regulators extended the benefit of lower regulatory capital consuming “simple transparent and standard” (STS) securitisation treatment to synthetic transactions too. This has proved to be the game changer.
Asset classes
While corporate loans still represent almost two-third of the underlying pool assets (63%) in 2024, composition of other asset classes were: SMEs (13%), auto loans (7%), residential mortgages (3%), and specialized lending (3%). As in the past, in 2024 some 80% of issued synthetic securitizations support commercial lending to Corporates and SMEs.
Investors
Specialised credit funds, aka private credit funds, and debt fund managers are the largest investors. The following graph shows the composition of SRT investors:

Some Recent transactions
The following are examples of some of the recent SRT transactions:
Banco Santander IFC transaction (2024)
The International Finance Corporation (IFC), a member of the World Bank Group, announced that it will provide a credit guarantee of $93 million to Banco Santander Mexico so that it can allocate more resources to financing small and medium-sized businesses (SMEs) in the country.
Aareal Bank (2025)
Aareal Bank, a German Bank completed its first SRT transaction, synthetically referencing a portfolio of performing European commercial real estate loans. With this transaction, Aareal Bank offered investors an opportunity to take exposure to a €2 billion CRE portfolio, which is equivalent to approximately 6 per cent of Aareal Bank’s overall CRE portfolio.
Basic Structure of SRT
Synthetic securitisation uses credit derivatives or similar devices to transfer the risk of a mezzanine tranche(s) of the credit risk of a pool of assets to capital markets by embedding such risk into credit-linked securities. The word “synthetic” is used in distinction to a traditional securitisation, which may be called “cash securitisation” or “true sale securitisation”. In every traditional or cash securitisation, there is a pooling of credit assets to constitute a reasonably diversified pool. The pool is then tranched into multiple tranches, such that, usually, the first loss tranche is retained by the originator, and mezzanine and senior tranches are moved to capital markets through a special purpose vehicle. The result is funding as well as risk transfer. The first loss piece, retained by the originator, neither leads to funding, nor risk transfer. However, for the mezzanine and senior tranches, there is a movement of money from the investors to the originator through the SPV, and risk transfer in the opposite direction. In synthetic securitisation, the purpose is not funding: the purpose is risk transfer. Therefore, the first loss piece still typically stays with the originator, but the risk in the mezzanine is moved to capital markets through the issue of credit-linked securities. The transfer of risk, without funding, may happen using credit default swaps, or guarantees
Structural Variations
SPV versus non-SPV structures
Over three-quarters of the reported trades in 2024 are issued without SPV. The percentage of protected tranche notional issued directly by banks increased from some 25% in 2016 to 73% in 2024.
SPV Structure:
In the case of an SPV structure, an SPV is brought in as an intermediary between the investors and the originator. In case of cash or traditional securitisation arrangements, an SPV is brought in to hold the assets as a repository for the investors. In synthetic structures, there is no transfer of assets at all, an SPV is commonly used for the following reasons:
- The funding raised by the investors is held and invested by the SPV. If there were no SPV, the funding would be held by the Originator, which would expose the originator to a counterparty risk as the originator would become the obligor for the securities.
- Further, the rating of the securities would consequently be capped at the originator’s rating due to the counterparty risk in case of an SPV structure.
- If the SPV was not there, the originator would issue the securities, which may impose withholding tax requirements on the originator. Which is why, typically for a cross border issuance, the SPV is located in a tax haven jurisdiction that will avoid tax implications.
The structure of SRT transactions has not changed from what it was before the GFC. For example, n December 2001, DBS Bank Singapore introduced its first synthetic securitisation transaction involving a reference portfolio of approximately S$2.8 billion of corporate loans. The transaction used credit default swaps to transfer credit risk to an SPV, ALCO 1 Limited, without a true sale of assets. The SPV issued around S$224 million of multi-currency, multi-tranche notes (rated from AAA to BBB), while DBS retained the first-loss and super-senior exposures. The deal enabled regulatory capital relief and risk-weighted asset optimisation, and is widely regarded as one of Asia’s earliest synthetic CLO-style transactions outside Japan, marking a milestone in regional structured finance markets. Although this transaction was undertaken more than two decades ago, the structure used primarily remains the same. The following diagram illustrates a common SRT SPV structure:

Non – SPV Structure:
As explained above, typically an SPV is required in cash or traditional structures for holding the asset, isolating it from the originator, protecting the assets from bankruptcy risks of the originator. A rating arbitrage, that is, any of the securities of the SPV being rated higher than the originator, is not theoretically possible if any of the securities represent a claim against the originator. In synthetic structures, there are no actual assets, only synthetic; therefore there is no need to protect the assets (meaning assets of the investors). However, synthetic CDOs do have assets to the extent of funding contributed by the investors. If this funding were to be prepaid or invested in the originator the claims of the investors are backed up by the claim against the originator, and hence, are subject to the rating cap of the originator.
It is understandable that the cash assets of a synthetic structure is only a fraction of the synthetic assets and hence the need for originator bankruptcy isolation is less prominent. A number of synthetic transactions have found it less necessary to involve a facade between the originator and the investors and have gone ahead with non- SPV structures. In this structure, the securities are issued by the originator himself and therefore represent a claim against the originator.
There are various Non-SPV structures observed in the market, Unfunded bilateral guarantee/CDS with no SPV, Funded bilateral guarantee/CDS with no SPV, Funded Credit Linked Note issued by originator with no collateral.
The table below shows the difference between SPV and Non-SPV structures:
| SPV Structure | Non-SPV Structure | |
| Counterparty risk | In the case of an SPV structure, the entire money paid by the investors will be held by the SPV. This ensures that the investors are protected from the counterparty risk w.r.t the originator since any amount paid by them is held by a bankruptcy remote vehicle. | In this case, the investor will be exposed to both the risk of default in the assets as well as counterparty risk of the originator, as opposed to the SPV structure, where the counterparty risk is eliminated. |
| Rating Cap | The SPV is a separate bankruptcy remote entity, and hence no cap on rating because of the counterparty risk of the originator. | The rating of the securities will be capped at the rating of the originator due to counterparty risk. |
Other structures
- Blind portfolio structures
In a blind reference pool SRT, the bank does not reveal borrower details to the investor or protection provider, and the investor only has access to high-level characteristics of the reference loan portfolio (such as industry distribution, credit ratings, or geographic exposure). Under this type of structure, investors face higher uncertainty as they must rely on the bank’s understanding of standards and risk management practices instead of conducting their own loan-level risk analysis.
- Funded Structures
In case of funded structures, the originator and the investor enter into a bilateral credit protection contract which may be drafted as a guarantee or a credit derivative. The investor then places a collateral equivalent to the maximum payment obligation under the contract. The money from this collateral amount deposited is only paid to the originator when losses hit the protected tranche. The collateral amount remaining after absorbing the losses is returned to the investor.
- Unfunded structures
Unfunded SRTs are transactions not secured by financial collateral. The investor (protection provider) does not make any upfront payments to cover potential losses and is only required to compensate the bank if a credit event occurs. The protection provider is considered to have a high enough credit quality to mitigate the counterparty risk and is subject to eligibility criteria in Europe. The protection providers are typically, in Europe, insurance companies, pension funds, or multilateral development banks. The bank originating the SRT is exposed to counterparty credit risk.
- SRT with replenishment period
SRTs with a replenishment period allow a bank to add new loans to the loan portfolio as old loans mature, subject to eligibility criteria. Typically, the loans will come from the same portfolio and share the original loan’s credit characteristics. The risk for the investor is potential asset quality deterioration of the reference pool, as the likelihood of credit losses could increase from lower asset quality loans being added, or from changes in the risk profile of the reference pool.
Economics of Risk Transfer
Consider a room with bombs placed in 5 different regions, as opposed to all the bombs placed in one place. The probability of a person stepping on the bomb will be far less in the first case than in the second one. The same is the case with assets.
The economics of risk transfer in securitisation are rooted in the principles of integration and differentiation that underpin structured finance. A diversified set of underlying assets is first aggregated into a single pool, enabling risk to be spread across a broader portfolio rather than remaining concentrated at the individual loan level. This pooled risk is then differentiated through tranching, whereby cash flows and credit risk are allocated among distinct tranches with varying risk-return profiles. Such structuring facilitates more efficient risk allocation and diversification, making the protection buyer better off as compared to obtaining guarantees or credit protection on each loan on a standalone basis, where risk remains fragmented and less efficiently distributed.
Thus, integration and differentiation ensure that correlation risk, or the risk that other assets also default on a default by one asset, is minimal.
Risks of SRT
The following are some of the risks associated with SRT Transactions:
- System-wide leverage and risk migration
SRTs transfer credit risk from banks to non-bank financial institutions (notably hedge funds and credit funds) that are typically less constrained by capital requirements and can employ higher leverage. This can increase aggregate leverage in the financial system, even if bank balance sheets appear safer. In many cases, banks also provide leverage to SRT investors, meaning part of the risk may remain indirectly within the banking system. - Interconnectedness and contagion risk
By redistributing bank-originated credit risk across banks, asset managers, hedge funds, insurers, and custodians, SRTs deepen inter-sector linkages. The private and opaque nature of many SRT deals makes it harder for supervisors to map exposures, raising the risk that stress in one segment (e.g., leveraged funds) propagates rapidly across the financial system. - Investor concentration and rollover risk
The SRT investor base is highly concentrated. Credit funds and asset managers account for a majority of demand, with a small group of large investors holding a dominant share of outstanding exposure. Further, since SRT maturities (typically 3–5 years) are often shorter than the underlying loan tenors, banks face rollover risk that is if investor appetite dries up, banks may experience a sudden increase in RWAs, capital pressure, and higher funding costs. - Weaker underwriting incentives over time
Strong demand for high-yield SRT tranches may attract more risk-tolerant investors, encouraging aggressive deal structuring or looser credit standards. Increased competition for SRT issuance can lead to sub-par due diligence, potentially worsening the quality of underlying loan pools and increasing vulnerability to credit shocks.
Regulatory capital
In an SRT transaction, a bank buys protection for the mezzanine tranche by issuing CLNs to investors. Under securitization treatment, the senior tranche carries 20 percent RWA, and the first-loss tranche carries 1,250 percent RWA. The RWA for the mezzanine tranche becomes zero because the bank is no longer exposed to the losses from this tranche.
The following examples illustrates maintenance of capital in case of SRT vs non-SRT transactions:
| Non-SRT (in USD million) | SRT (in USD million) | ||
| Asset Pool | 100 | Asset Pool | 100 |
| RWA ratio | 50% | First Loss Tranche % | 0.50% |
| RWA | 50 | RWA ratio | 1250% |
| Tier 1 Capital | 10.50% | RWA | 6.25 |
| Tier 1 Capital Required | 5.3 | Mezzanine Tranche % | 4.50% |
| RWA ratio (as risk transferred, backed by cash) | 0% | ||
| RWA | 0 | ||
| Senior Tranche | 95% | ||
| RWA ratio | 20% | ||
| RWA | 19 | ||
| Total Capital Required | 2.7 | ||
Thus, the capital required to be maintained in case of SRT structures is significantly lower as compared to non-SRT structures thus allowing originators capital relief. This, however, is a function of the size of the junior tranche. In the same example as above, if the thickness of the junior tranche was 3%, the required capital would have gone up.
Regulatory Permissibility of SRT
In India, synthetic securitisation, which is defined as a structure where the credit risk of an underlying pool of exposures is transferred, in whole or in part, through the use of credit derivatives or credit guarantees that serve to hedge the credit risk of the portfolio, which remains on the balance sheet of the NBFC, is prohibited. [para 5(3) of the Reserve Bank of India (Non-Banking Financial Companies – Securitisation Transactions) Directions, 2025]. Accordingly, SRT transactions where there is only a transfer of the risk and rewards without the transfer of the asset are prohibited in India.
The below table shows the regulatory permissibility of SRT in various jurisdictions:
| Countries | Regulatory Permissibility of SRT |
| India | Prohibited |
| Australia | Not eligible for capital relief |
| UK | Permissible |
| Hong Kong | Permissible |
| Canada | Permissible |
| Indonesia | Prohibited |
| China | Prohibited |
| Japan | Permissible within regulatory limits |
| EU | Permissible |
| Korea | Prohibited |
| Singapore | Permissible |
Over the years, SRTs have become a very potent tool for regulatory capital and risk management. SRTs have also permitted private credit funds to acquire exposure on loan portfolios without organically creating them. The regulatory antipathy for synthetic securitisation was the multiple layers of risk transfers as seen during the GFC. This was, however, more in case of structured finance CDOs and arbitrage transactions. SRTs are currently mostly related to on-balance sheet assets – hence, the question of any unwarranted risk transfers or risk build up do not arise. Of course, any securitisation transaction creates an interconnection between the banking system and capital markets, but that is also a cushion against risk as it has a potential for risk of contagion.
Bibliography
- 2026 Regulatory Reviews Mark Inflection for Securitisation SRT Market | FitchRatings
- Rated Securitisations: Using SRTs to Optimise Financial Balance Sheets | FitchRatings
- Global SRT Insurance Survey – Select Results | IACPM
- Recycling Risk: Synthetic Risk Transfers | IMF
- Unveiling the impact of STS on-balance-sheet securitisation on EU financial stability |European Systematic Risk Board
- 2025 wrapped: Structured finance year in review | Structured Credit Investor
Full Day Workshop on Securitisation, Transfer of Loans and Co-lending
The Pre-Summit workshop dated 28th May, 2026 is Sold Out! We have announce a repeat workshop on 27th May, 2026. Register your interest now before the seats fill up again!
Register Here : https://forms.gle/maTWJ2kBowndrLVS8
Loading…
Our Other Upcoming events:
Updates to RBI’s PSL Directions: Clarifications and Minor Amendments
Harshita Malik | finserv@vinodkothari.com
Refer our detailed write-up on the topic titled as Bank-NBFC Partnerships for Priority Sector Lending: Impact of New Directions
Meta-morphed: A corporate bond that puts $27 billion off-the-balance-sheet
Meta structures a data center investment funding with cash flows linked with rentals and guarantees
– Vinod Kothari | finserv@vinodkothari.com
In India, we often say: upar wala sab dekhta hai (God sees it all). However, if I could do things which God the almighty does not or cannot see, I will be most happy to do those. Doing things off-the-balance-sheet is always equally tempting; structurers of Frankenstein financial instruments have already tried to bring ingenuity to explore gaps in accounting standards to create such funding structures where the asset or the relevant liability does not show on the books. Recently, a $ 27 billion bond issuance by an SPV called Beignet Investor, LLC may have the ultimate effect of keeping the massive investment done at the instance of Meta group kept off-the-balance-sheet.
Structural Features
Essentially, the deal involves issuance of bonds to the investors, the servicing of which is through the cash flows generated from the lease payments. Further, a residual value guarantee has been provided by the group entity which has again led to a rating upliftment for the bonds issued.
The essential structure of the transaction involves a combination of project finance, lease payments and a residual value guarantee to shelter investors from project-related risks, and use of an operating lease structure, apparently designed to keep the funding off the balance sheet of Meta group. It is a special purpose joint venture which keeps the funding liability on its balance sheet.
Let us understand the transaction structure:
- Meta intends to do a huge capex to build a massive 2.064-GW data center campus in Richland Parish, LA. The cost of this investment is estimated at $27 billion in total development costs for the buildings and long-lived power, cooling, and connectivity infrastructure at the campus. The massive facility will take until 2029 to finish.
- The expense will be incurred by a joint venture, formed for the purpose, where Meta (or its group entities) will hold a 20% stake, and the 80% stake will come from Blue Owl Capital. The two of them together form the JV called Beignet Investor, LLC (issuer of the bonds).
- The JV Co owns an entity called Laidley LLC, which will be the lessor of the data center facilities.
- The lessee is a 100% Meta subsidiary, called Pelican Leap LLC, which enters into 4 year leases for each of the 11 data centers. Each lease will have a one-sided renewal option with 4 years’ term each, that is to say, a total term at the discretion of the lessee adding to 20 years. The leases are so-called triple-net (which is a term very commonly used in the leasing industry, implying that the lessor does not take any obligations of maintenance, repairs, or insurance).
- The 20-year right of use, though in tranches of 4 years at a time, will mean the rentals are payable over as many years. This is made to coincide with the term of amortisation of the bonds issued by the Issuer, as the bonds mature in 2049 (2026-2029 – the development period, followed by 20 years of amortisation).
- If the lease renewal is at the option of the lessee, then, how is it that the lease payments for 20 years are guaranteed to amortise the bonds? This is where the so-called “residual value guarantee” (RVG) comes in. RVG is also quite a common feature of lease structures. In the present case, from whatever information is available on public domain, it appears that the RVG is an amount payable by Meta Platforms under a so-called Residual Value Guarantee agreement. The RVG on each renewal date (gaps of 4 years) guarantees to make a payment sufficient to take care of the debt servicing of the bonds, and is significantly lower than the estimated fair value of the data center establishment on each such date.
The diagram below by provides for the transaction structure:

Off-balance sheet: Gap in the GAAP?
Of course, as one would have expected, the rating agency Standard and Poor’s that was the sole rating agency having given rating for the bonds, its report does not say the structure is off-the-balance sheet for the lessee, a Meta group entity. However, various analysts and commentators have referred to this funding as off-the-balance sheet. For example, Bloomberg report says “The SPV structure helps tech companies avoid placing large amounts of debt on their balance sheets”. Another report says that the huge debt of $ 27 billion will be on the balance sheet of Beignet, the JV, rather than on the books of Meta. An FT report says that bond was priced much higher than Meta’s balance sheet bonds, at a coupon of 6.58%, as a compensation for the off-balance sheet treatment it affords. A write up on Fortune also refers to this funding as off-the-balance sheet.
In fact, Meta itself, on its website, gives a clear indication that the deal was struck in a way to ensure that the funding is not on the balance sheet of Meta or its affiliates. Here is what Meta says:
“Meta entered into operating lease agreements with the joint venture for use of all of the facilities of the campus once construction is complete. These lease agreements will have a four-year initial term with options to extend, providing Meta with long-term strategic flexibility.
To balance this optionality in a cost-efficient manner, Meta also provided the joint venture with a residual value guarantee for the first 16 years of operations whereby Meta would make a capped cash payment to the joint venture based on the then-current value of the campus if certain conditions are met following a non-renewal or termination of a lease.”
Here, two points are important to understand – first, the operating lease/financial lease distinction, and second, the so-called residual value guarantee – what it means, and why it is opposite in the present case.
The distinction between financial and operating leases, the key to the off-balance sheet treatment of operating leases, was the product of age-old accounting standards, dating back to the 1960s. In 2019, most countries in the world decided to chuck these accounting standards, and move to a new IFRS 16, which eliminates the distinction between financial and operating leases, at least from the lessee perspective. According to this standard, every lease will be put on the balance sheet, with a value assigned to the obligation to pay lease rentals over the non-cancellable lease term.
However, USA has not aligned completely with IFRS 16, and decided to adopt its own version called ASC 842 for lease accounting. The US accounting approach recognises the difference between operating leases and financial leases, and if the lease qualifies to be an operating lease, it permits the lessee to only bring an amount equal to the “lease liability”, that is, the discounted value of lease rentals as applicable for the lease term.
As to whether the lease qualifies to be an operating lease, or financial lease, one will apply the classic tests of present value of “lease payments” [note IFRS uses the expression “minimum lease payments”], length of lease term vis-a-vis the economic life of the asset, existence of any bargain purchase option, etc. “Lease payments” are defined to include not just the rentals payable by a lessee, but also the minimum residual value. This is coming from para 842-10-25-2(d). The reading of this para is sufficiently complicated, as it makes cross references to another para referring to a “probable payment” under “residual value guarantees”. The reference to para 842-10-55-34 may not be needed in the present case, as the residual value agreed to be paid by the lessee is included in “lease payment” for financial lease determination by virtue of the very definition of financial lease. Therefore, it remains open to interpretation whether the leases in the present case are indeed operating leases.
Considering that the residual value guarantee from the parent company in the present case may not meet the requirements for its inclusion in “lease payments”, it is unlikely that the lease payments over any of the 4 year terms will meet the present value test, to characterise the lease as a financial lease. Also, the economic life of the commercial property in form of the data centers may be significantly longer than the 20 year lease period, including the option to renew. Hence, the lease may quite likely qualify as an operating lease.
Residual value guarantee: Rationale and Implications
In lease contracts, a residual value guarantee by the lessee is understandable as a conjoined obligation with fair use and reasonable wear and tear of assets. In the present case, if the lessee is a tenant for only 4 years, and the renewal thereafter is at the option of the lessee. If the lessee chooses not to renew the lease, the lessee is exercising its uncontrolled discretion available under the lease. So, what could be the justification for the parent company being called to make a payment for the residual value of the property? After all, the property reverts to the lessor, and whatever is the value of the property then is the asset of the lessor.
In the present case, it seems that the RVG comes under a separate agreement – whether that agreement is linked with the leases is not sure. However, for the holistic understanding of any complicated transaction, one always needs to connect all the dots together to get a a complete understanding of the transaction. If the lessee or a related party is paying for future rentals, it transpires that the understanding between the parties was a non-cancelable lease, and the RVG is a compensation for the loss of future rentals to the lessor. If that is the overall picture, then the lease may well be characterised as a financial lease.
Is the lessee’s balance sheet immune from the bond payment liability?
A liability is what one is obligated to pay; a commitment to pay. The $ 27 billion liability for the bonds in the present case sits on the balance of the JV Company. However, the question is, ultimately, what is it that will ensure the repayment of these bonds? Quite clearly, the payment for the bonds is made to match with the underlying lease payments, with a target debt service coverage. In totality, it is the lease payments that discharge the bond obligation; there is nothing else with the JV company to retire or redeem the bonds. From this perspective as well, an off-balance-sheet treatment at the lessee or at the group level seems tough.
However, off-balance-sheet may not be the objective really. What matters is, does the structure insulate Meta group from the risks of the payments from the data center. From the available data, it appears that the project related risks, from delays in completion to non-renewal, are all taken by Meta. Therefore, even from the viewpoint of project-related risks, there do not seem to be sufficient reasons for any off-balance sheet treatment.
Disclaimer: The analysis in the write-up above is limited to the reading that could be done from write-ups/materials in public domain.
Other Resources: