The securitisation tax regime in India had recently undergone change. The Finance Minister in his budgetary speech last year had made a mention of the relevance of securitisation and had inserted a new chapter on securitisation taxation. Chapter XII EA of the Income Tax Act required special purpose vehicles to deduct tax on the income distributed by it. Ofcourse there was a pretext to these provisions where mutual funds were finding it difficult to convince the tax authorities of absence of any tax leakages in these structures and the tax provisions did bring some relief to the funds as their income from securitisation was exempt from taxation. However, seemingly the rest of the industry clearly got unsettled with tax regime.
An ICRA report[1] has revealed adverse impact on the volume of securitization post the new tax regime. Volumes of securitization shrunk in FY 2013-14 whereas bilateral assignments grew considerably. The rated securitisation deals showed a 5% decline after reporting Rs. 28,800 crores of volume. In spite of the decrease in the overall volumes, the residential mortgage backed securities showed a growth of 75% (albeit on a small base). The volumes of the asset backed securities seemed to follow the industry trend and reported a 14% decline in its volumes. The chart below shows the trend in securitisation issuances in last few years:
|
|
FY 2009-10 |
FY 2010-11 |
FY 2011-12 |
FY 2012-13 |
FY 2013-14 |
|||||
|
|
Amount |
Share |
Amount |
Share |
Amount |
Share |
Amount |
Share |
Amount |
Share |
|
ABS |
21497 |
50% |
21819 |
69% |
27344 |
71% |
27230 |
90% |
23504 |
82% |
|
RMBS |
6254 |
14% |
5029 |
16% |
7680 |
21% |
3025 |
10% |
5296 |
18% |
|
Total Retail Securitisation |
27751 |
64% |
26848 |
84% |
35024 |
92% |
30255 |
100% |
28800 |
100% |
|
LSO |
14581 |
34% |
4441 |
14% |
2217 |
6% |
– |
– |
– |
– |
|
Others |
787 |
2% |
536 |
2% |
635 |
2% |
– |
– |
– |
– |
|
Overall Total |
43118 |
100% |
31825 |
100% |
37876 |
100% |
30255 |
100% |
28800 |
100% |
|
Growth |
(20%) |
|
(26%) |
|
19% |
|
(20%) |
|
(5%) |
|
|
Average Deal Size |
231 |
|
200 |
|
174 |
|
151 |
|
149 |
|
Source: http://www.indiainfoline.com/Markets/News/ICRA/5920451229 last visited on 2nd June 2014
Further, the ABS market continues to be dominated by commercial vehicle, construction equipment accounting 61% of the total volumes, the microfinance loans follows with 22% share and the SME and tractor loans together constitutes 6% of the total ABS market. The graphic below would show asset class wise ABS distribution. During the year somewhere around 30 RMBS transactions were carred out, but the average deal size came down to Rs. 177 crores from Rs. 303 crores.
Asset Class-wise distribution of ABS Pools for the years ending on 31st March 2013 and 31st March 2014 –
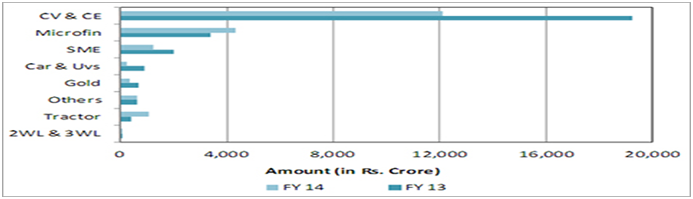
Source: http://www.indiainfoline.com/Markets/News/ICRA/5920451229 last visited on 2nd June 2014
Priority sector lending has been the key motivation for undertaking securitisation transactions. Market Participants welcomed the much awaited guidelines on reset of credit enhancement in securitization transactions which would allow releasing the credit enhancements, however that has had no impact in converting the benefits into volumes as such. Clearly when the securitisation tax regime was introduced the market had a sense of the damage it could do which is now visible in numbers as well.
[1] http://www.icra.in/Files/ticker/SH-2014-1-ICRA-Structured%20Finance.pdf
— Reported by Abhirup Ghosh